Category: InfoViz

20 Years of Blogging and Coding: Reflections on an Unexpected Journey

Reading Time: 2 minutes This week marks the 20th anniversary of when I first started writing online and published my first blog post. In 2010, I released my first open-source project: an unofficial Fitbit API written in Perl. At the time, I had no grand vision—just curiosity and a desire to document my thoughts and pursue my passion across…
Read more

Fitness Tracking Platform: Update on Progress

Reading Time: 4 minutes Last August, I enthusiastically blogged about an idea I had for creating a Fitness Tracking Platform; personal informatics for fitness.  Since that time I’ve been gradually making progress and am getting closer to fulfilling that original vision.  I figured I would do a quick writeup and share some of the progress I’ve made, and layout…
Read more

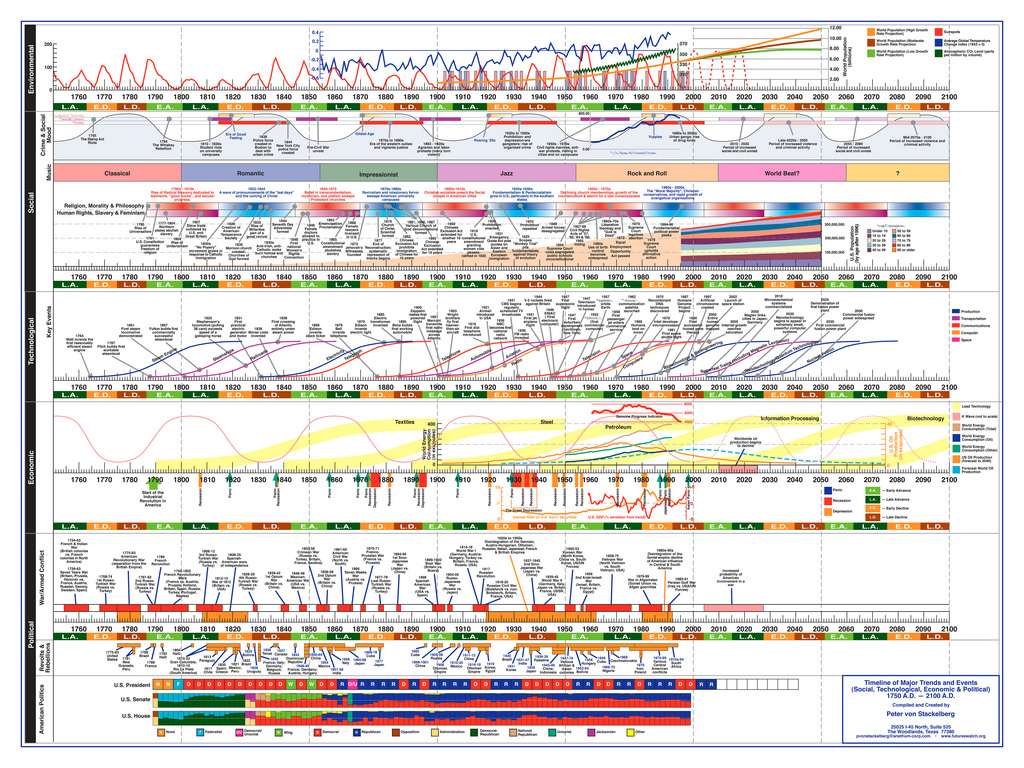
Timeline of Major Trends and Events (Social, Technological, Economic & Political)

Reading Time: < 1 minute I found a unique and visually stunning infographic on FlickR today: Timeline of Major Trends and Events (Social, Technological, Economic & Political) Peter von Stackelberg designed this complex timeline of social, technological, economic and political events and trends from 1750 to 2100. Each time series shows graphs, events and categories on a common scale. Peter…
Read more

Information Visualization Toolkits for Mind Mapping

Reading Time: 2 minutes The other week, I wrote a blog post The Visual Wiki: A New Metaphor For Knowledge Access and Management. At the time, until I read the paper in depth, I hadn’t realized that this was about a project that I had blogged about last year: Thinkbase – A Visual Semantic Wiki. In a nutshell: “Thinkbase…
Read more

15 Effective Tools for Visual Knowledge Management

Reading Time: 9 minutes I’ve discovered a number of interesting applications that help people efficiently organize information. There certainly is no shortage of solutions for this problem domain. Many tools exist that offer the ability to discover, save, organize, search, and retrieve information.

How to Create Stunning 3D Timelines

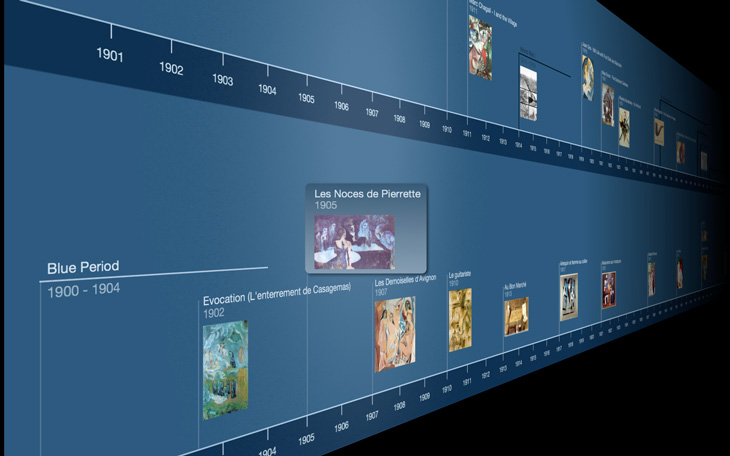
Reading Time: < 1 minute I have to admit, when I first came across this software last week I was instantly impressed. I’ve had a fascination with software that allow you to visualize and comprehend information in different and exciting ways. Bee Docs Timeline, an application for Mac OS X (sorry Windows and Linux fans), is a great example of how to create and present smooth, professional looking timelines in a relatively easy fashion.

Interactive Map of the Linux Kernel

Reading Time: < 1 minute Nothing like combining my love of linux geekery and information visualization: Click here to check out the interactive map.

Visual Mapping Body of Knowledge

Reading Time: < 1 minute I recently caught an article that Chuck Frey posted earlier in the month on the Mind Mapping Software Blog.  In the article, The case for a Visual Mapping Body of Knowledge, Chuck interviews Wallace Tait. Wallace Tait is a professional visual mapping consultant based in the Canadian Province of Ontario. He is the co-author of…
Read more

Knowledge Management Visualization Upgrades

Reading Time: < 1 minute Just discovered some exciting news from Semantic Media Wiki: SMW now supports Ploticus and Exhibit for powerful data visualizations. From http://semantic-mediawiki.org/wiki/New_data_visualization_for_SMW:_Exhibit_and_Ploticus 22 Jan 2009. Semantic Result Formats (SRF), the add-on package for query formats in SMW, has just been extended with two great additions for powerful data visualisation: Ploticus and Exhibit. Both are available to…
Read more

Visual Understanding Environment (VUE)

Reading Time: < 1 minute The Visual Understanding Environment (VUE) project at Tufts is focused on creating flexible tools for managing and integrating digital resources in support of teaching, learning and research. VUE provides a flexible visual environment for structuring, presenting, and sharing digital information. At its core, the Visual Understanding Environment (VUE) is a concept and content mapping application,…
Read more