Genealogy of Influence Redux: Visualization with Many Eyes

The other day I posted about an intriguing project by Mike Love called The Genealogy of Influence. You can check out his blog here. Since I also recently blogged about the Many Eyes project by IBM, I thought it would be interesting to see if I could take Mike’s original data and upload for visualization.
I took the source GraphML file here, and *very* quickly parsed it to generate a tab-delimited file. I simply parsed each EDGE entry using Perl and created a hash for each person. This hash listed the individuals that person influenced, the people they were influenced by, and a tally for each of those data sets. This data is obviously not normalized since I planned to try out a few different visualization types using the same source data.
e.g.
| Person | Knows | Total Influenced (count) | Total Influenced By (count) |
| Alkaji | Pascal | 1 | 0 |
| AmmoniusSaccas | Plotinus | 2 | 2 |
| AmmoniusSaccas | Origen | 2 | 2 |
| Ampere | Maxwell | 1 | 2 |
| Anaxagoras | Pericles | 3 | 0 |
The upload data set was posted here.
Here are some of the visualization types I experimented with.
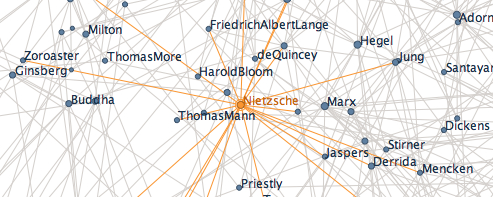
Network Diagram
This is somewhat similar to the graph on the Geneaology of Influence site. However, it’s not a directed graph, and it’s not interactive like TouchGraph.
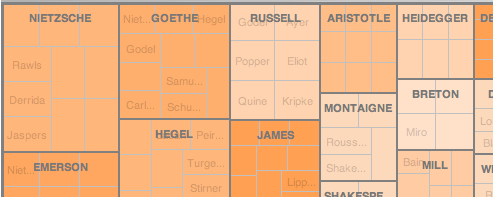
Treemap
I think the treemap is probably the most interesting alternative to the network/graph diagram. You can easily switch between the people that were most influential, and also who had the most influences.
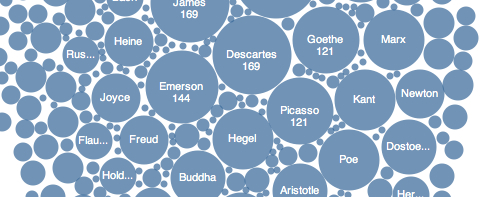
Bubble Chart
I tried this last visualization method just for kicks. The bubble chart isn’t the most effective visualization, but it does allow you to easily see influence by bubble size.
2 Responses
Semantic Wikis and Faceted Browsing: The Ultimate Knowledge Database
Every 6 months or so I mix things up and alternate my primary area of focus between studying philosophy and pursuing my creative technical interests (e.g. my multitude of pet/geek projects). I decided to switched gears a couple weeks ago…